Photographies early history as a scientific tool, especially for data capture and visualisation, meant that the potential of astrophotography was recognised early on.
Photographies early history as a scientific tool, especially for data capture and visualisation, meant that the potential of astrophotography was recognised early on.
Photographies early history as a scientific tool, especially for data capture and visualisation, meant that the potential of astrophotography was recognised early on.
Photographies early history as a scientific tool, especially for data capture and visualisation, meant that the potential of astrophotography was recognised early on.
This is a plot of a 5000 image dataset arranged according to the sensor sensitivity of the images.
.jpg)
Content is grouped here into bright, often planetary, images on the circumference representing a low sensor sensitivity and darker, milky way galaxy images in the centre representing higher sensor sensitivity.
Lets zoom in a little...
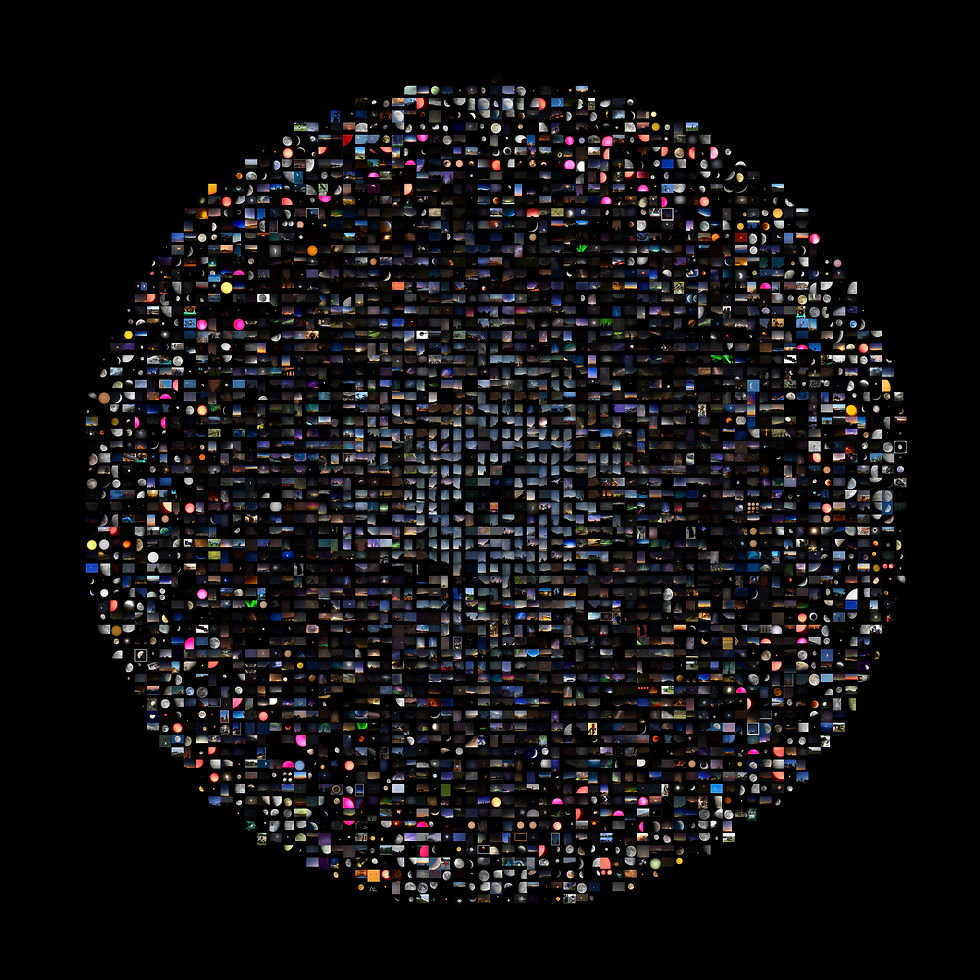
Notice that the moons and planets are at the edges with the galaxy clustered toward the centre.
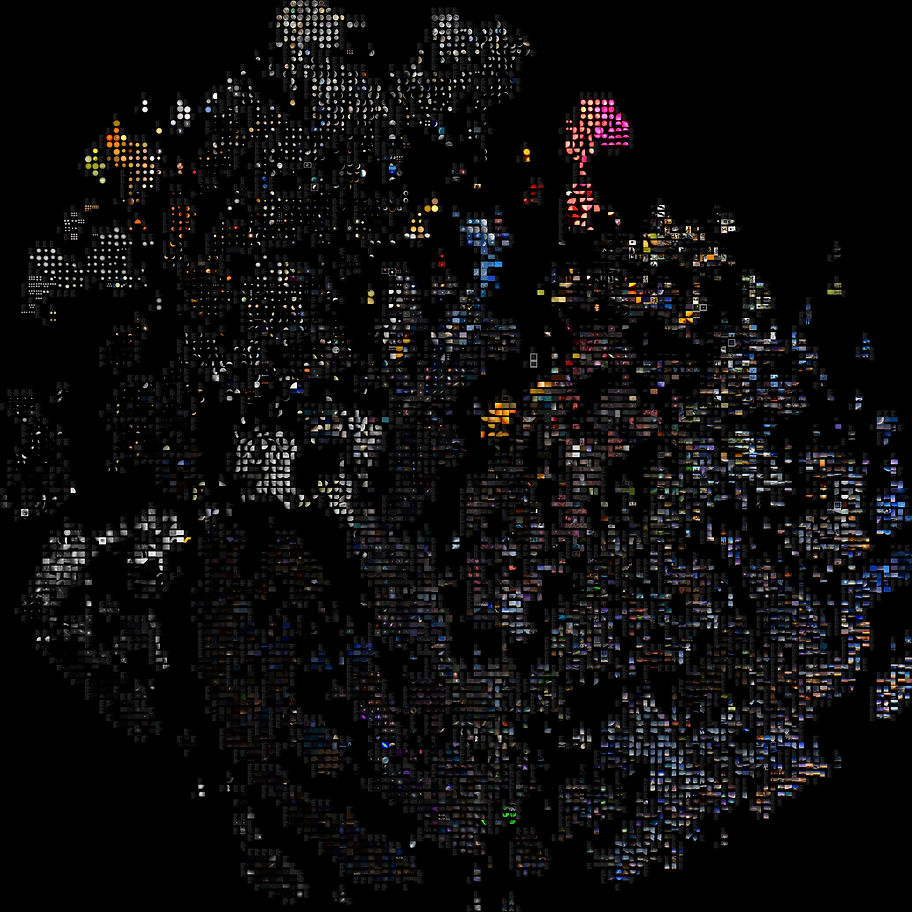
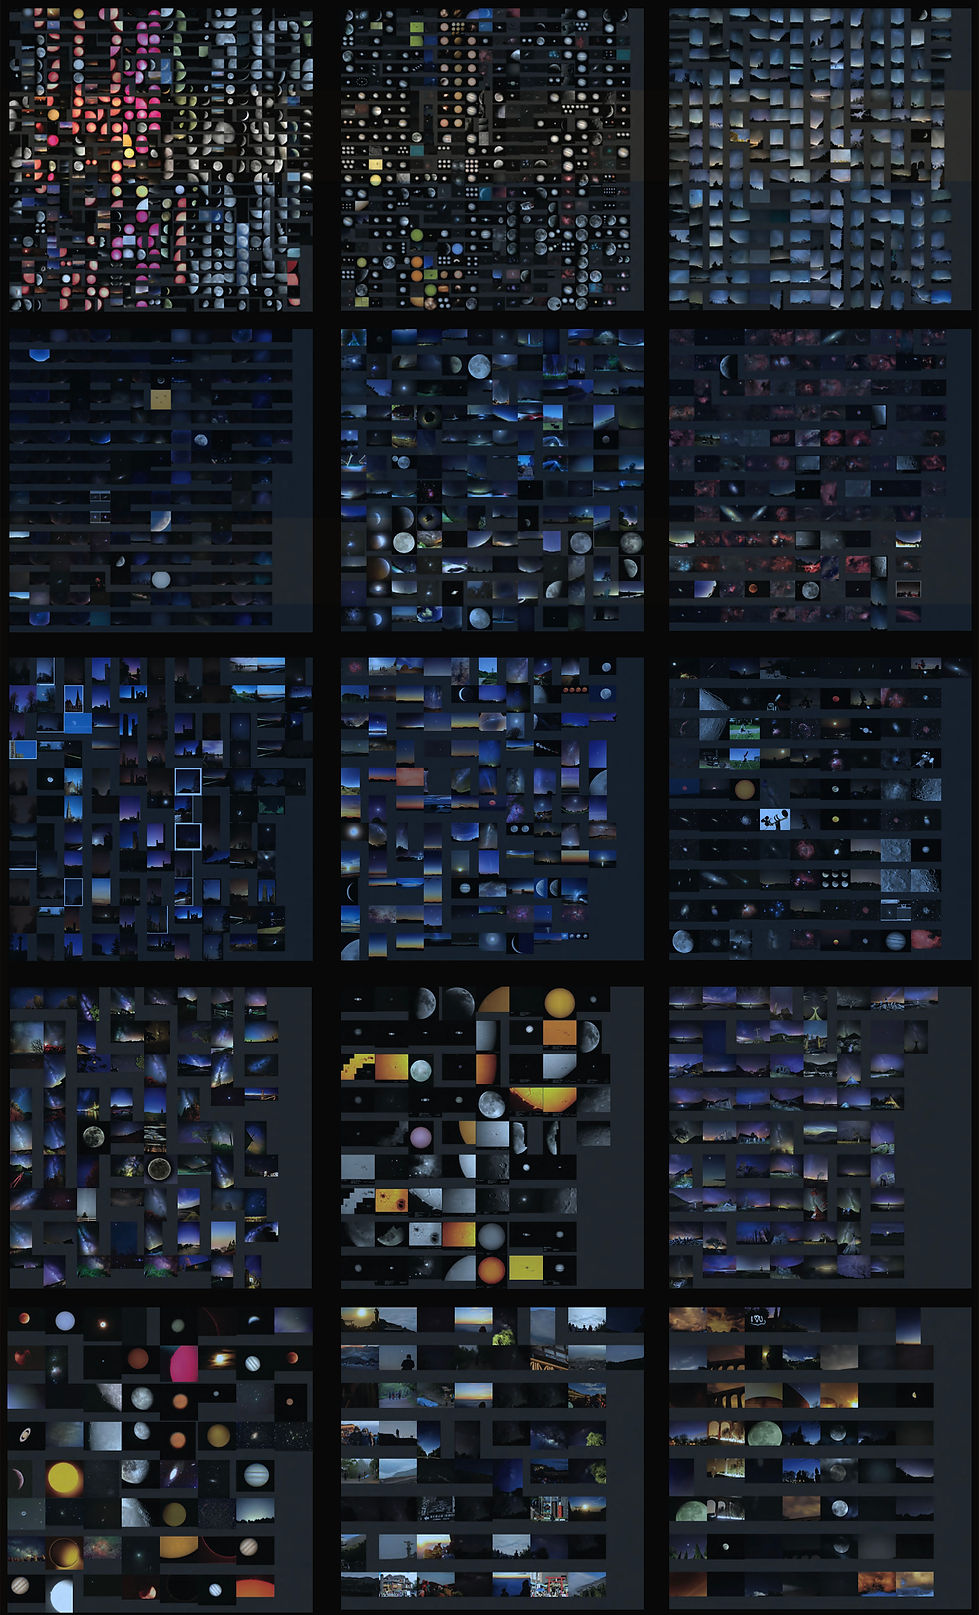
Here is a plot of the same 5000 image dataset instead arranged according to tags attributed to their content by image recognition algorithms. We can see here that content is grouped into clusters of similar images.
.jpg)
Lets zoom in on this too...

Notice here that we can see clusters of the moons and planets grouped
according to their visual similarity.
Lets look at what we can understand by looking at one of these clusters that we call the "Pink Extra Planetary Cluster"...
The pink extra planetary objects cluster features both whole objects and partial segments of objects. Often images such as this are captured by individuals or groups of individuals interested in focusing on one astrophotographic phenomena
.png)
This group is an excellent example of multiple divergent outliers all clustered into one area. To the image recognition software these outliers will share aspects in common that still place them in the closest relation to each other.
Clusters such as this often include outliers that have some features in common with the main group but enough difference to require them to be placed in an adjacent object space.
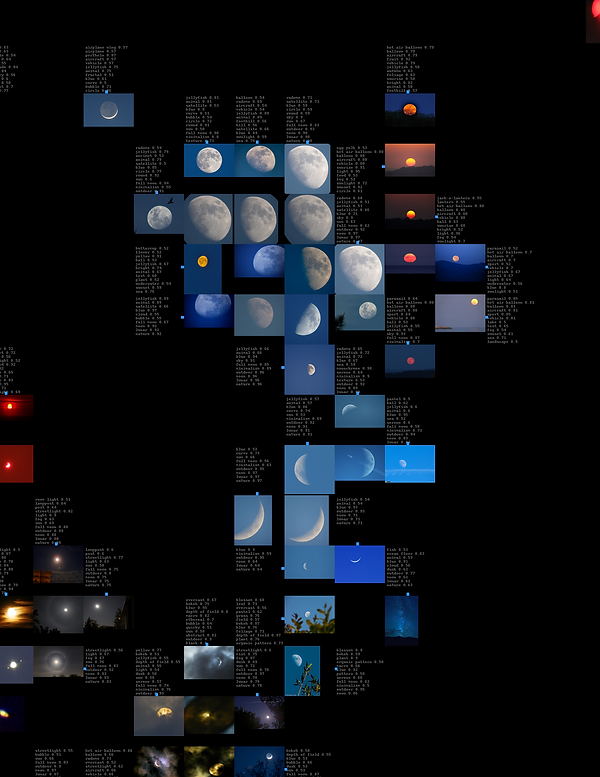
Now lets look at what we can understand by looking at the "Moon with Blue Sky Cluster"...
.png)
The Moon/sky cluster is an example of the image recognition systems relative sophistication. Here we have a wide range of moon captures both as a traditional white moon in a blue sky and as blood moons in a sunrise and sunset sky.
This lower right cluster features images of the moon shot with vegetation in the foreground. The framing of both subjects in such a way usually marks the amateur photographers in this dataset and can be confirmed by cross referencing metadata regarding the camera types used to capture the photos and the frequency with which those cameras travel (or in the case of amateurs, don't travel).
The image recognition tagging software can distinguish between blood moons in a sunset/sunrise sky and a sun setting in the sky. This is why these moons that look like sunsets are clustered here.
Finally, lets look at what we can understand by focusing on data specific to the capture of galaxies...
.png)
This cluster of galaxy images is representative of astrophotographers who shoot both galaxies and foreground in the same image. The machine learning tags have also included images with the northern lights in them because compositionally they adhere to the pattern of an image with content in both the night sky and the foreground. Variations of this composition tend to by the kinds of shot most popular on instagram and in print media but less representative of what space agencies and professional amateurs look for when they concentrate specifically astral phenomena.
.png)
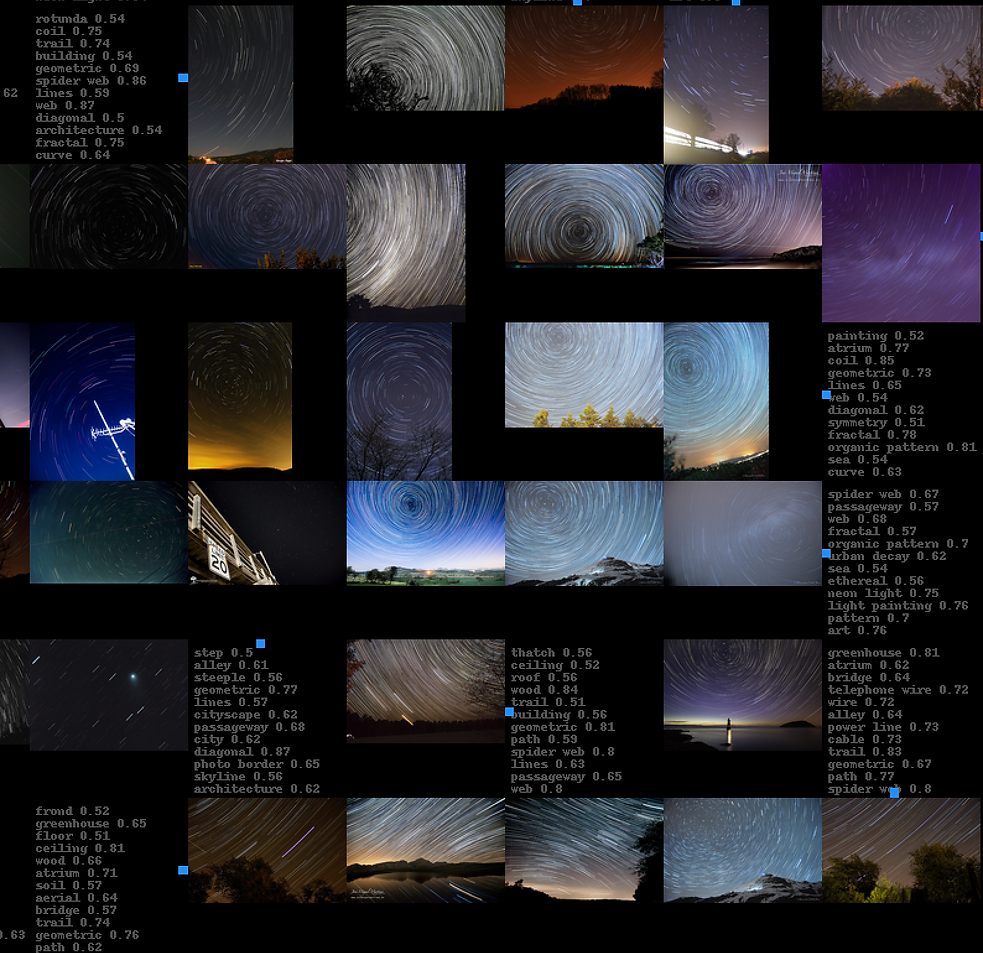
We are nearly at the end of our data dive now. Here we have images sorted according to their content focus on star trails revolving around the north star.
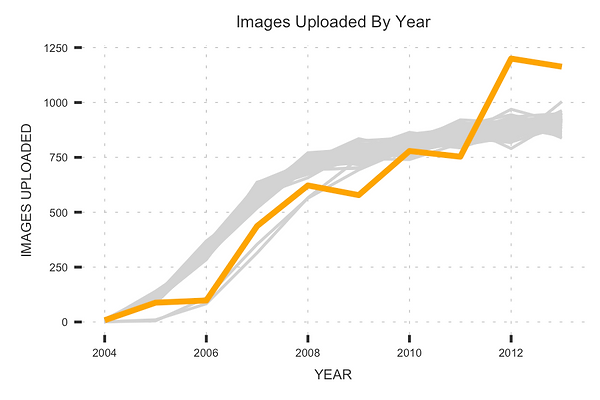
Scroll down to review a collection of image data that represents the top 15 contributors by photographer to this image dataset. As you will see, many of these datasets show a pattern in the type of content that individual photographers focus on.
So what conclusions can we really draw from all of this?
.png)